Monitoring out of firm conviction
Many companies know this: Only with more transparency in energy consumption, possibly supplemented by targeted process data acquisition, can truly sustainable cost savings be achieved as a first important step. However, companies often shy away from the supposedly high effort and costs involved.
All good reasons why our IIoT gateway (BY000002) in combination with the energy measurement module (AB000008) has now attracted a lot of attention from a number of companies, particularly because we believe the solutions are very versatile, flexible and easy to implement.
Let's be honest: a lot of self-praise is always suspicious, but in this case it is justified because we also use the gateway in our own company. This is not just about collecting and analyzing specific consumption data ourselves, but also about opening up new potential uses for the gateway, for example in conjunction with our sensor solutions.
Where is energy needed?
Along with energy from the grid, we use a photovoltaic system installed on the company roof with a total of 676 modules and a total output of 260 kW peak to generate electricity for the company building we moved into in 2020 (floor space approx. 6,000 square meters on two floors). Our building is heated via a heat pump, which is coupled as a hybrid system with a gas boiler that only goes into operation at sub-zero temperatures.
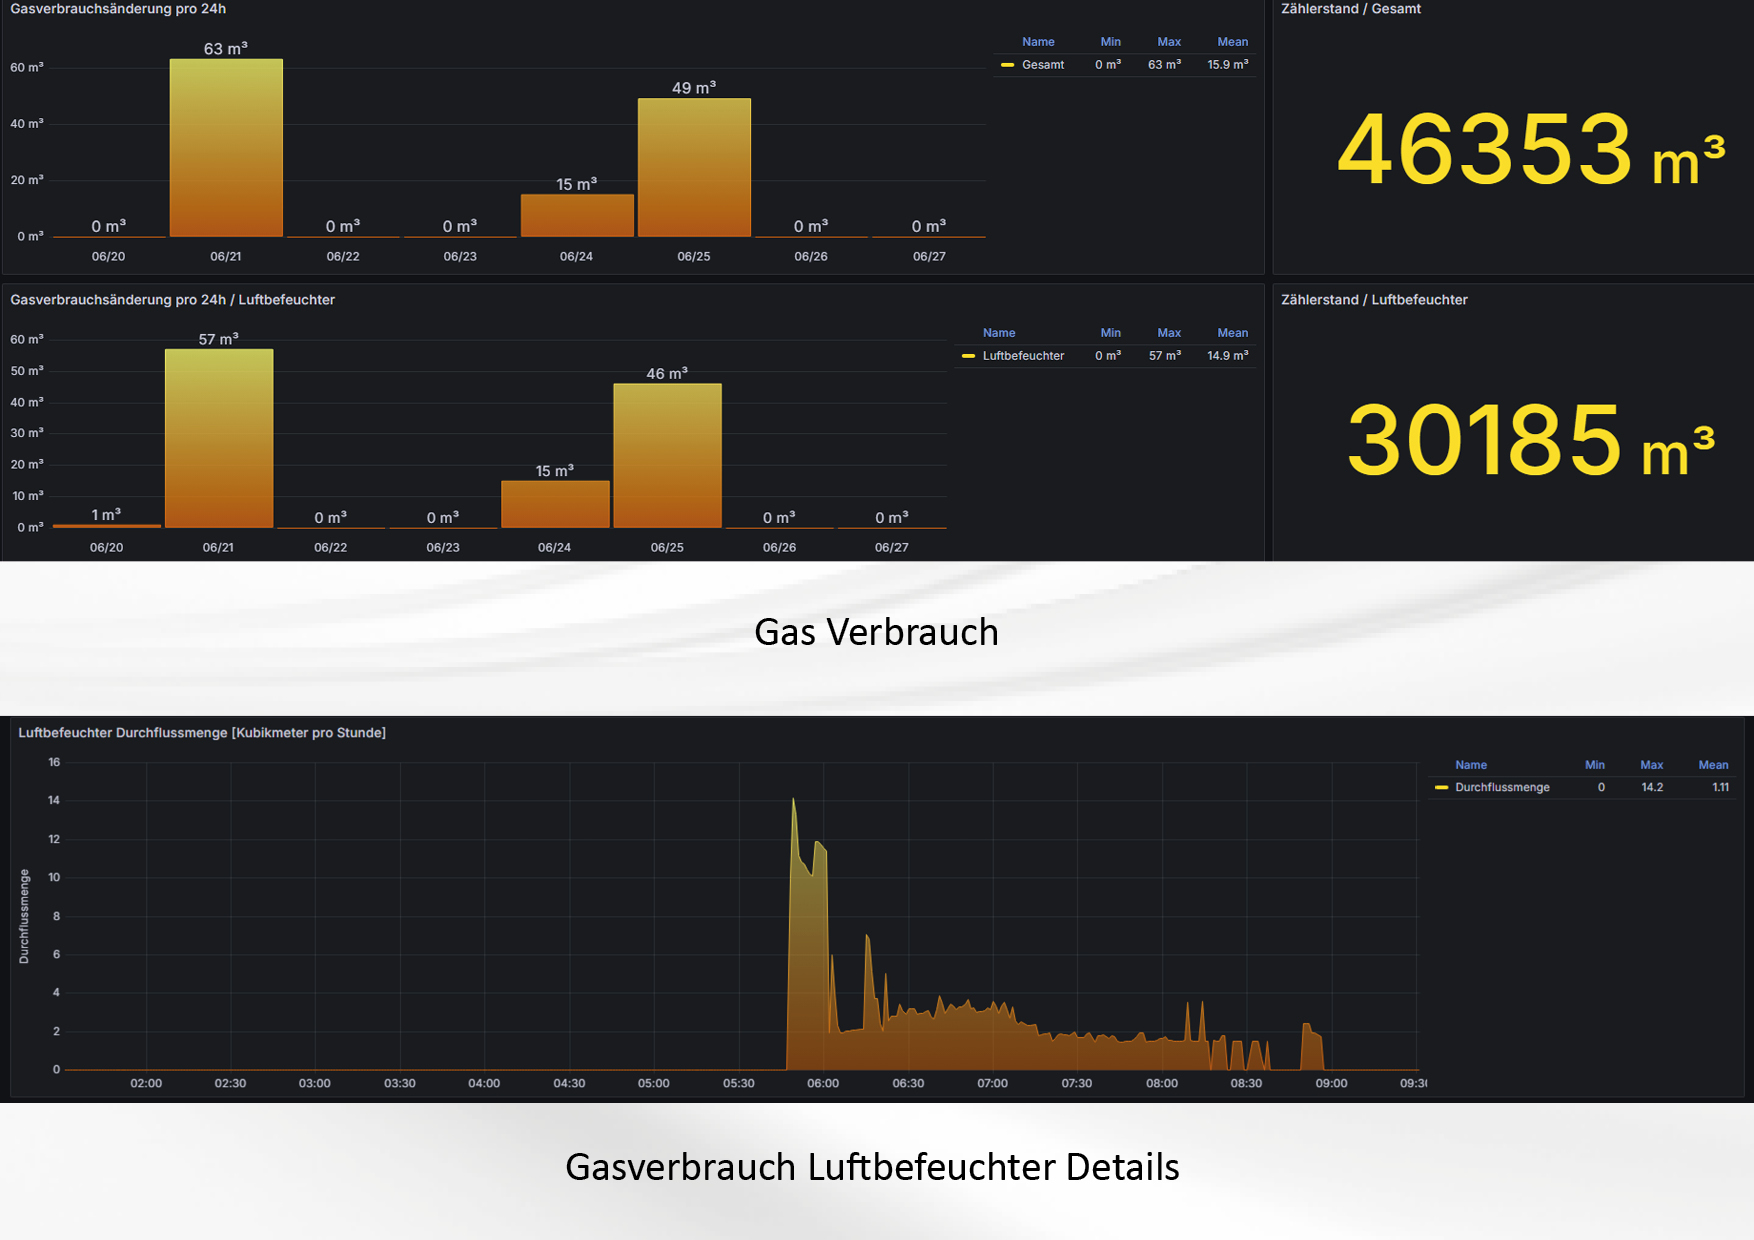
However, a large part of the gas consumption is accounted for by an air humidification system in our production facility with a total area of approx. 1,300 square meters. A wide variety of ovens are located here, which we use, for example, to harden the potting compound used to contactor the electronics in housings or to test the resistance of sensors for high temperature ranges. The air here would therefore usually be very dry and not straightforwardly pleasant for our employees. The air humidification system is therefore essential for us to ensure a good indoor climate in production.
How are the consumption levels distributed?
Although most companies know exactly which areas have high energy requirements, they still don't know exactly how consumption is actually distributed in detail. It was the same for us at first. But it is precisely this information that is essential in order to identify the causes of potentially high consumption and better recognize potential savings.
To do this, we only need a single IIoT gateway, which was connected to the main electricity and gas meters via appropriate interfaces to obtain exact consumption data. One of our flow sensors, calibrated for natural gas, was installed for the humidification system. Finally, all the data is brought together straight in the gateway and visualized on a clear dashboard on the PC.
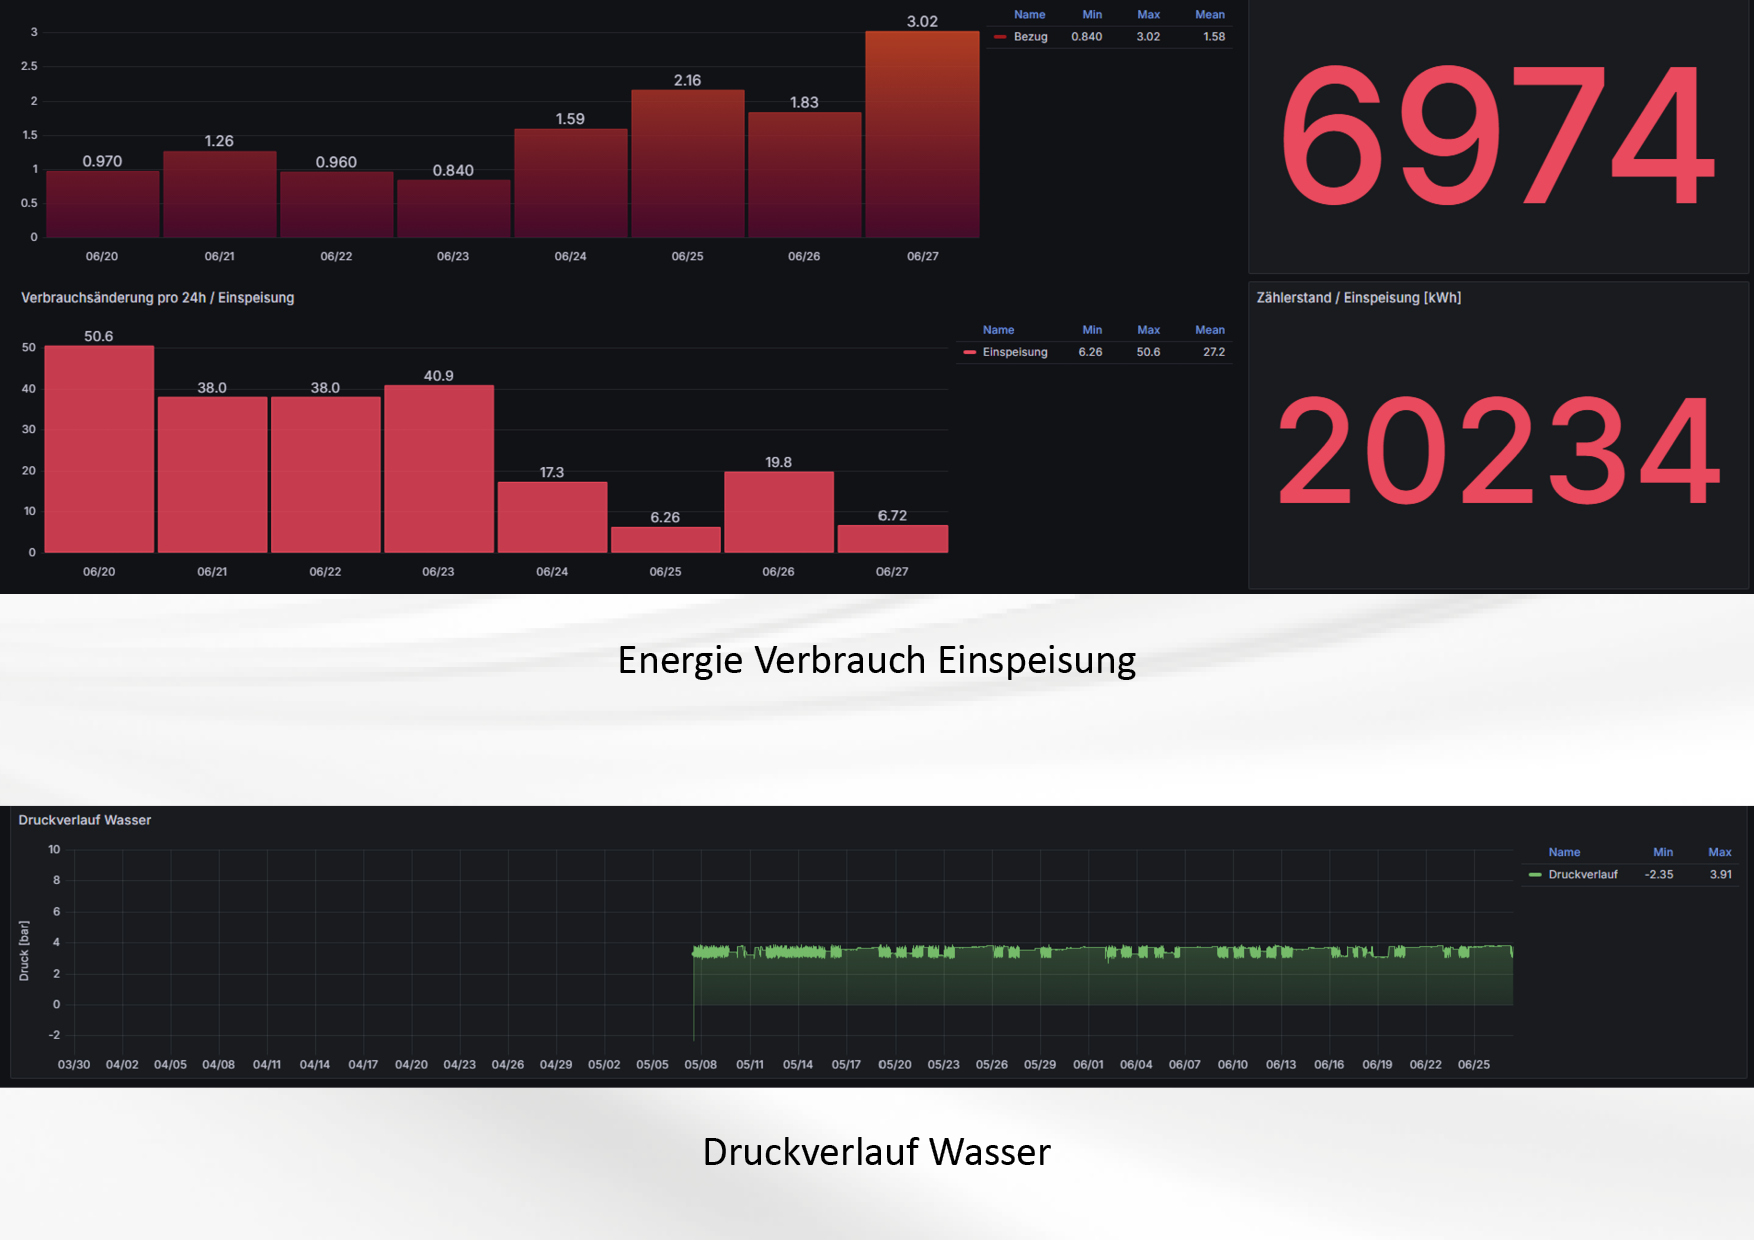
In addition, we also installed one of our pressure sensors in a straightforward location because we occasionally had problems with pressure peaks in the water pipe. Thanks to the sensor's maximum value memory, we were finally able to precisely delimit the time periods for the sporadically occurring pressure peaks in order to resolve the problem. The sensor's analog output is also connected to the gateway so that we can also monitor and visualize the values provided by the device.
What insights can be gained?
Instead of guessing, we can now use the total gas consumption and the measured volume flow for the humidification system, for example, to tell exactly how much is required for each individual consumer (heating/humidification) at any time. There is also interesting additional information such as whether the gas boiler to support the heat pump actually only goes into operation at a predefined outside temperature, how long or how often it switches on for this purpose or whether the gas consumption for humidification deviates significantly within a certain period of time due to the operating times of the furnaces, and, and, and...
In addition to such data and much more, we also use the gateway to obtain a detailed overview of the general functioning of our systems.
Of course, we also measure the electricity production of our PV system and compare it to the energy consumption from the grid. We can then use this information to derive minimum, maximum and average values, for example, in addition to total electricity consumption, and in this context recognize possible fluctuations in electricity consumption or unexpectedly high consumption, among other things. With the database now available, we can also determine how efficiently the PV system is still generating electricity after a certain period of operation and in which period the efficiency may decrease noticeably or measurably.
And what happens next?
But these are just a few examples of the many possible applications and benefits that the gateway provides from our own experience for greater transparency at very different levels of observation.
And because we stand for an immense range of different sensors in addition to the solutions described, we will successively supplement the system installed so far with further proprietary technologies whenever this seems sensible in order to leverage new and previously unrecognized potential for our customers.
A few selected case studies show the concrete ideas for monitoring that various companies have developed together with us and implemented at a manageable cost: